


The Phillips Curve represents one of economics’ most debated relationships, illustrating the inverse connection between inflation and unemployment that has shaped monetary policy for decades. Named after economist A.W. Phillips, who first observed this pattern in 1958 while studying wage inflation and unemployment data in the United Kingdom from 1861-1913, the curve suggests that policymakers face a fundamental trade-off: lower unemployment typically comes at the cost of higher inflation, and vice versa.
This economic theory gained widespread acceptance during the 1960s, when governments believed they could manipulate fiscal and monetary policies to achieve desired combinations of inflation and unemployment rates. The concept seemed to offer policymakers a clear roadmap for economic management, suggesting that stimulating aggregate demand could reduce unemployment while accepting slightly higher inflation as the price.
However, the relationship’s stability came under severe scrutiny during the 1970s stagflation period, when economies experienced both high inflation and high unemployment simultaneously—a phenomenon that directly contradicted the Phillips Curve’s predictions. This crisis forced economists to reconsider the theory’s validity and led to significant modifications in how we understand the inflation-unemployment relationship.
Understanding the Original Phillips Curve Theory
 Phillips Curve (Image via Getty)
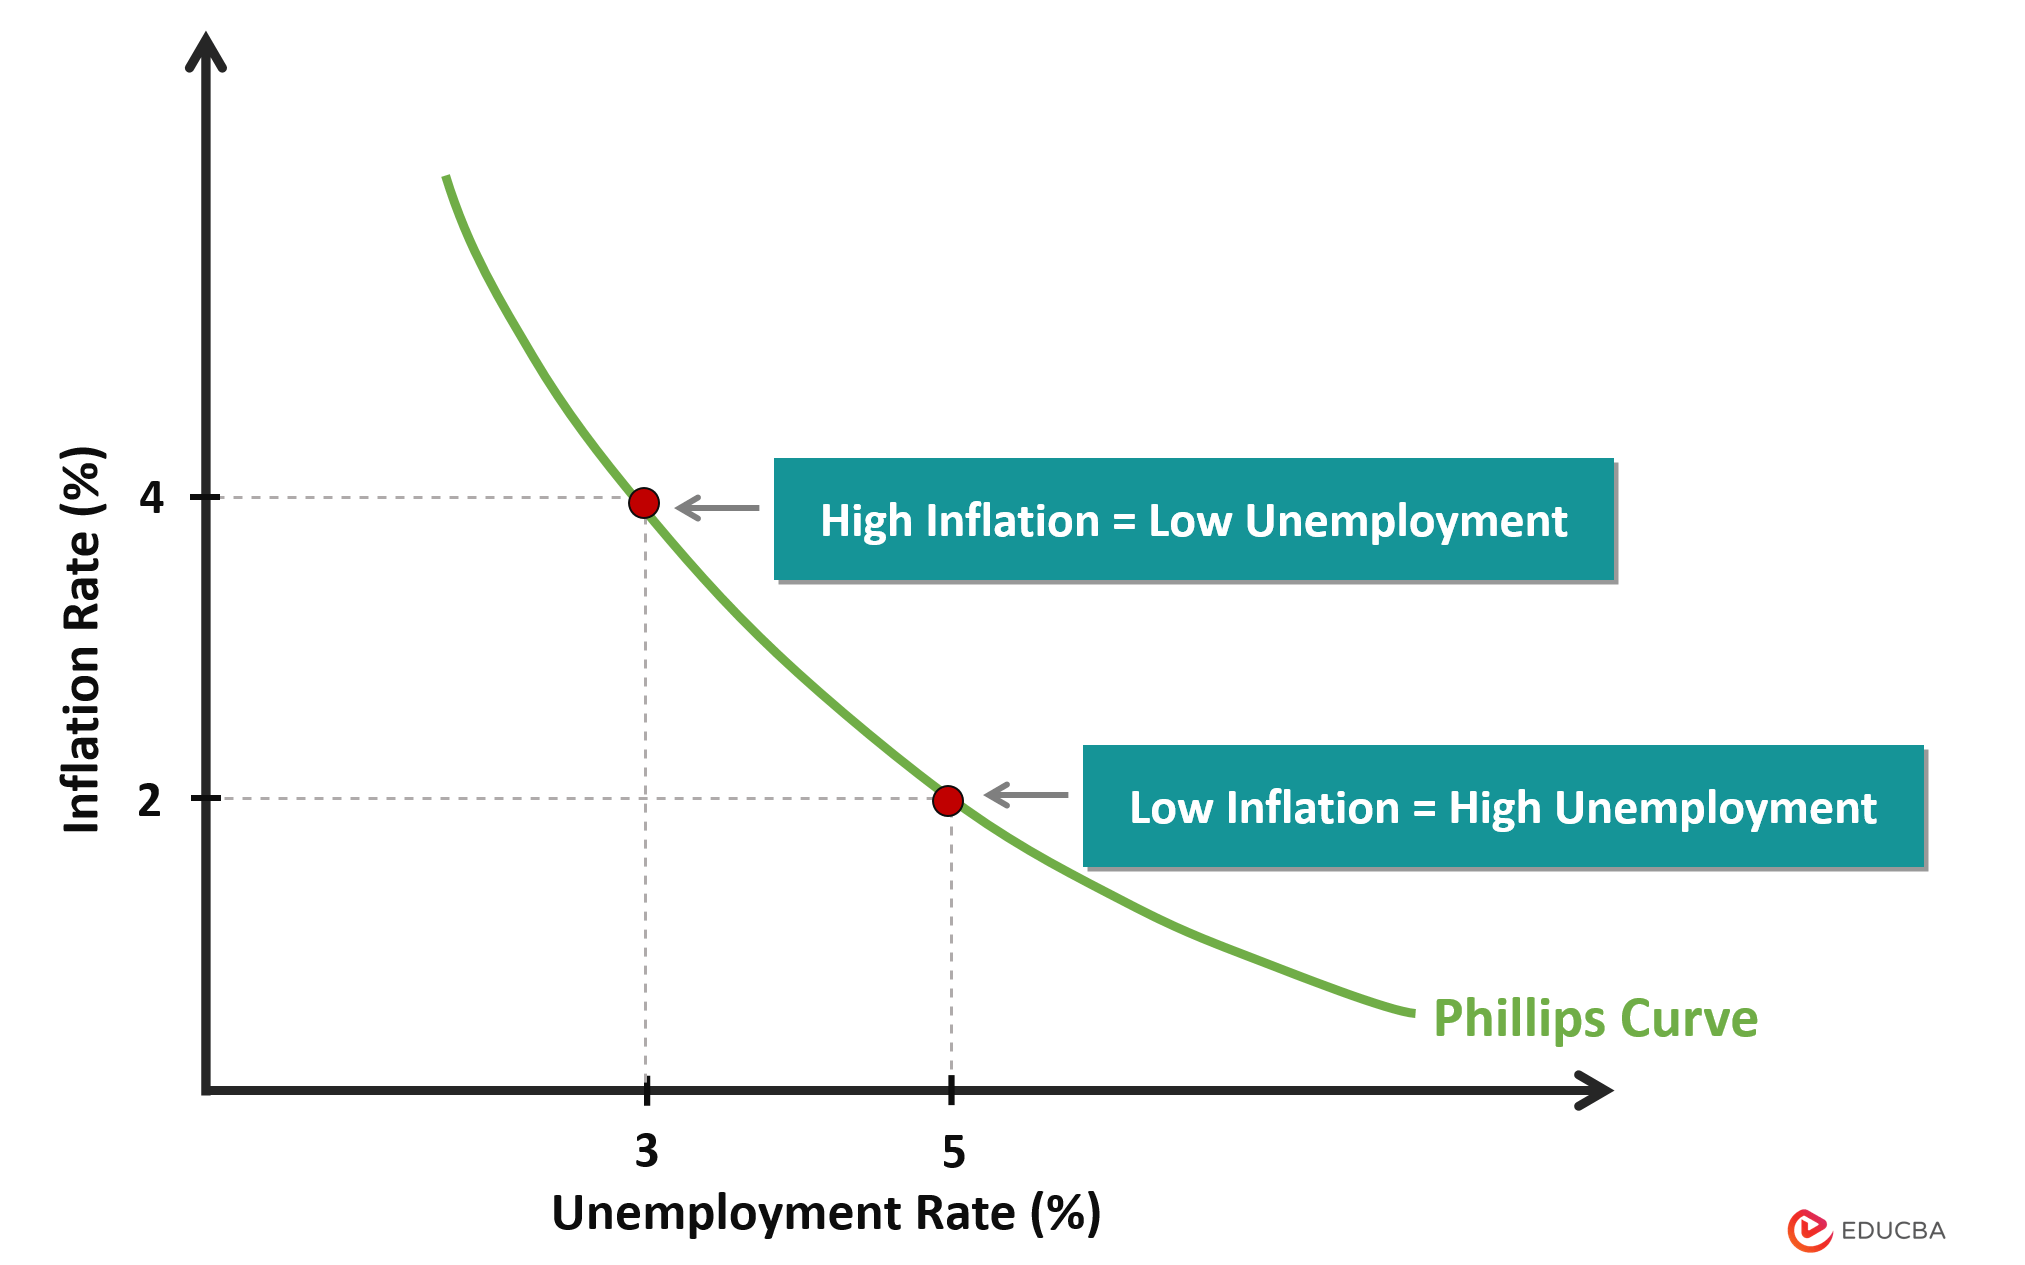
The Phillips Curve theory emerged from Phillips’ empirical observation that periods of low unemployment in Britain coincided with higher wage inflation, while high unemployment periods saw lower wage growth. This relationship was later extended to general price inflation, creating the familiar downward-sloping curve that plots inflation on the vertical axis against unemployment on the horizontal axis.
The underlying economic logic seemed straightforward: when unemployment falls, labor becomes scarce, forcing companies to compete for workers by offering higher wages. These increased labor costs then translate into higher prices for goods and services, driving up inflation. Conversely, when unemployment rises, wage pressures diminish, leading to lower inflation rates.
During the 1960s, this relationship appeared remarkably stable, leading many governments to adopt “stop-go” strategies where they would expand or contract the economy to achieve target inflation rates. The belief was that policymakers could choose their preferred point along the Phillips Curve, trading off between inflation and unemployment based on economic priorities.
The Stagflation Challenge and Theoretical Evolution
The 1970s marked a turning point for Phillips Curve theory when stagflation—the simultaneous occurrence of high inflation and high unemployment—shattered confidence in the stable trade-off relationship. This period demonstrated that supply-side factors, such as oil price shocks, could push both inflation and unemployment higher simultaneously, creating economic conditions the original Phillips Curve couldn’t explain.
Milton Friedman and Edmund Phelps revolutionized the theory by introducing the role of inflation expectations. They argued that the Phillips Curve relationship only holds in the short run, and that in the long run, there is no permanent trade-off between inflation and unemployment. Their modified version suggested that if workers and businesses expect higher inflation, they adjust their behavior accordingly, shifting the entire Phillips Curve and eliminating any long-term trade-off.
This evolution led to the concept of the “natural rate of unemployment”—a level where inflation remains stable regardless of monetary policy interventions. The long-run Phillips Curve became vertical at this natural rate, indicating that sustained attempts to keep unemployment below this level would only result in accelerating inflation without permanent employment gains.
Modern Relevance and Recent Developments
 Phillips Curve (Image via Getty)
Despite decades of criticism, recent research suggests the Phillips Curve isn’t dead but has evolved significantly. The relationship appeared to flatten considerably from the 1980s through the 2010s, leading many economists to question its continued relevance. During this period, unemployment fell dramatically in many countries without corresponding increases in inflation, puzzling policymakers and economists alike.
However, the post-pandemic economic recovery has brought renewed attention to the Phillips Curve. Evidence from 2021-2022 shows that the relationship has not only “reawakened” but has actually steepened in many industrialized countries. The Phillips curves in the United States, United Kingdom, and France became significantly steeper during the recovery period compared to the flat relationships observed before the pandemic.
This steepening suggests that the “sacrifice ratio”—the unemployment increase needed to reduce inflation by one percentage point—has decreased, meaning monetary policy may be more effective at controlling inflation than previously thought. Recent studies indicate that declines in unemployment are now associated with larger increases in inflation than during the pre-pandemic period.
Contemporary Applications and Policy Implications
Modern economists emphasize that the Phillips Curve relationship exhibits significant non-linearities and depends heavily on various factors including inflation expectations, labor market conditions, and the economic environment. The relationship may be stronger when inflation is already elevated or when the economy operates near full employment.
Central banks continue to monitor Phillips Curve dynamics, though with greater sophistication than in the 1960s. The Federal Reserve and other monetary authorities recognize that the relationship between unemployment and inflation remains relevant for policy decisions, even if it’s more complex and unstable than originally believed.
The Phillips Curve’s enduring relevance lies not in providing a simple policy menu, but in highlighting the complex interactions between labor markets, price dynamics, and monetary policy. While the stable trade-off of the 1960s no longer exists, understanding these relationships remains crucial for effective economic management in an era of evolving inflation dynamics and changing labor market structures.